𝜏-Bench leaderboard: compare, explore, and understand agent performance
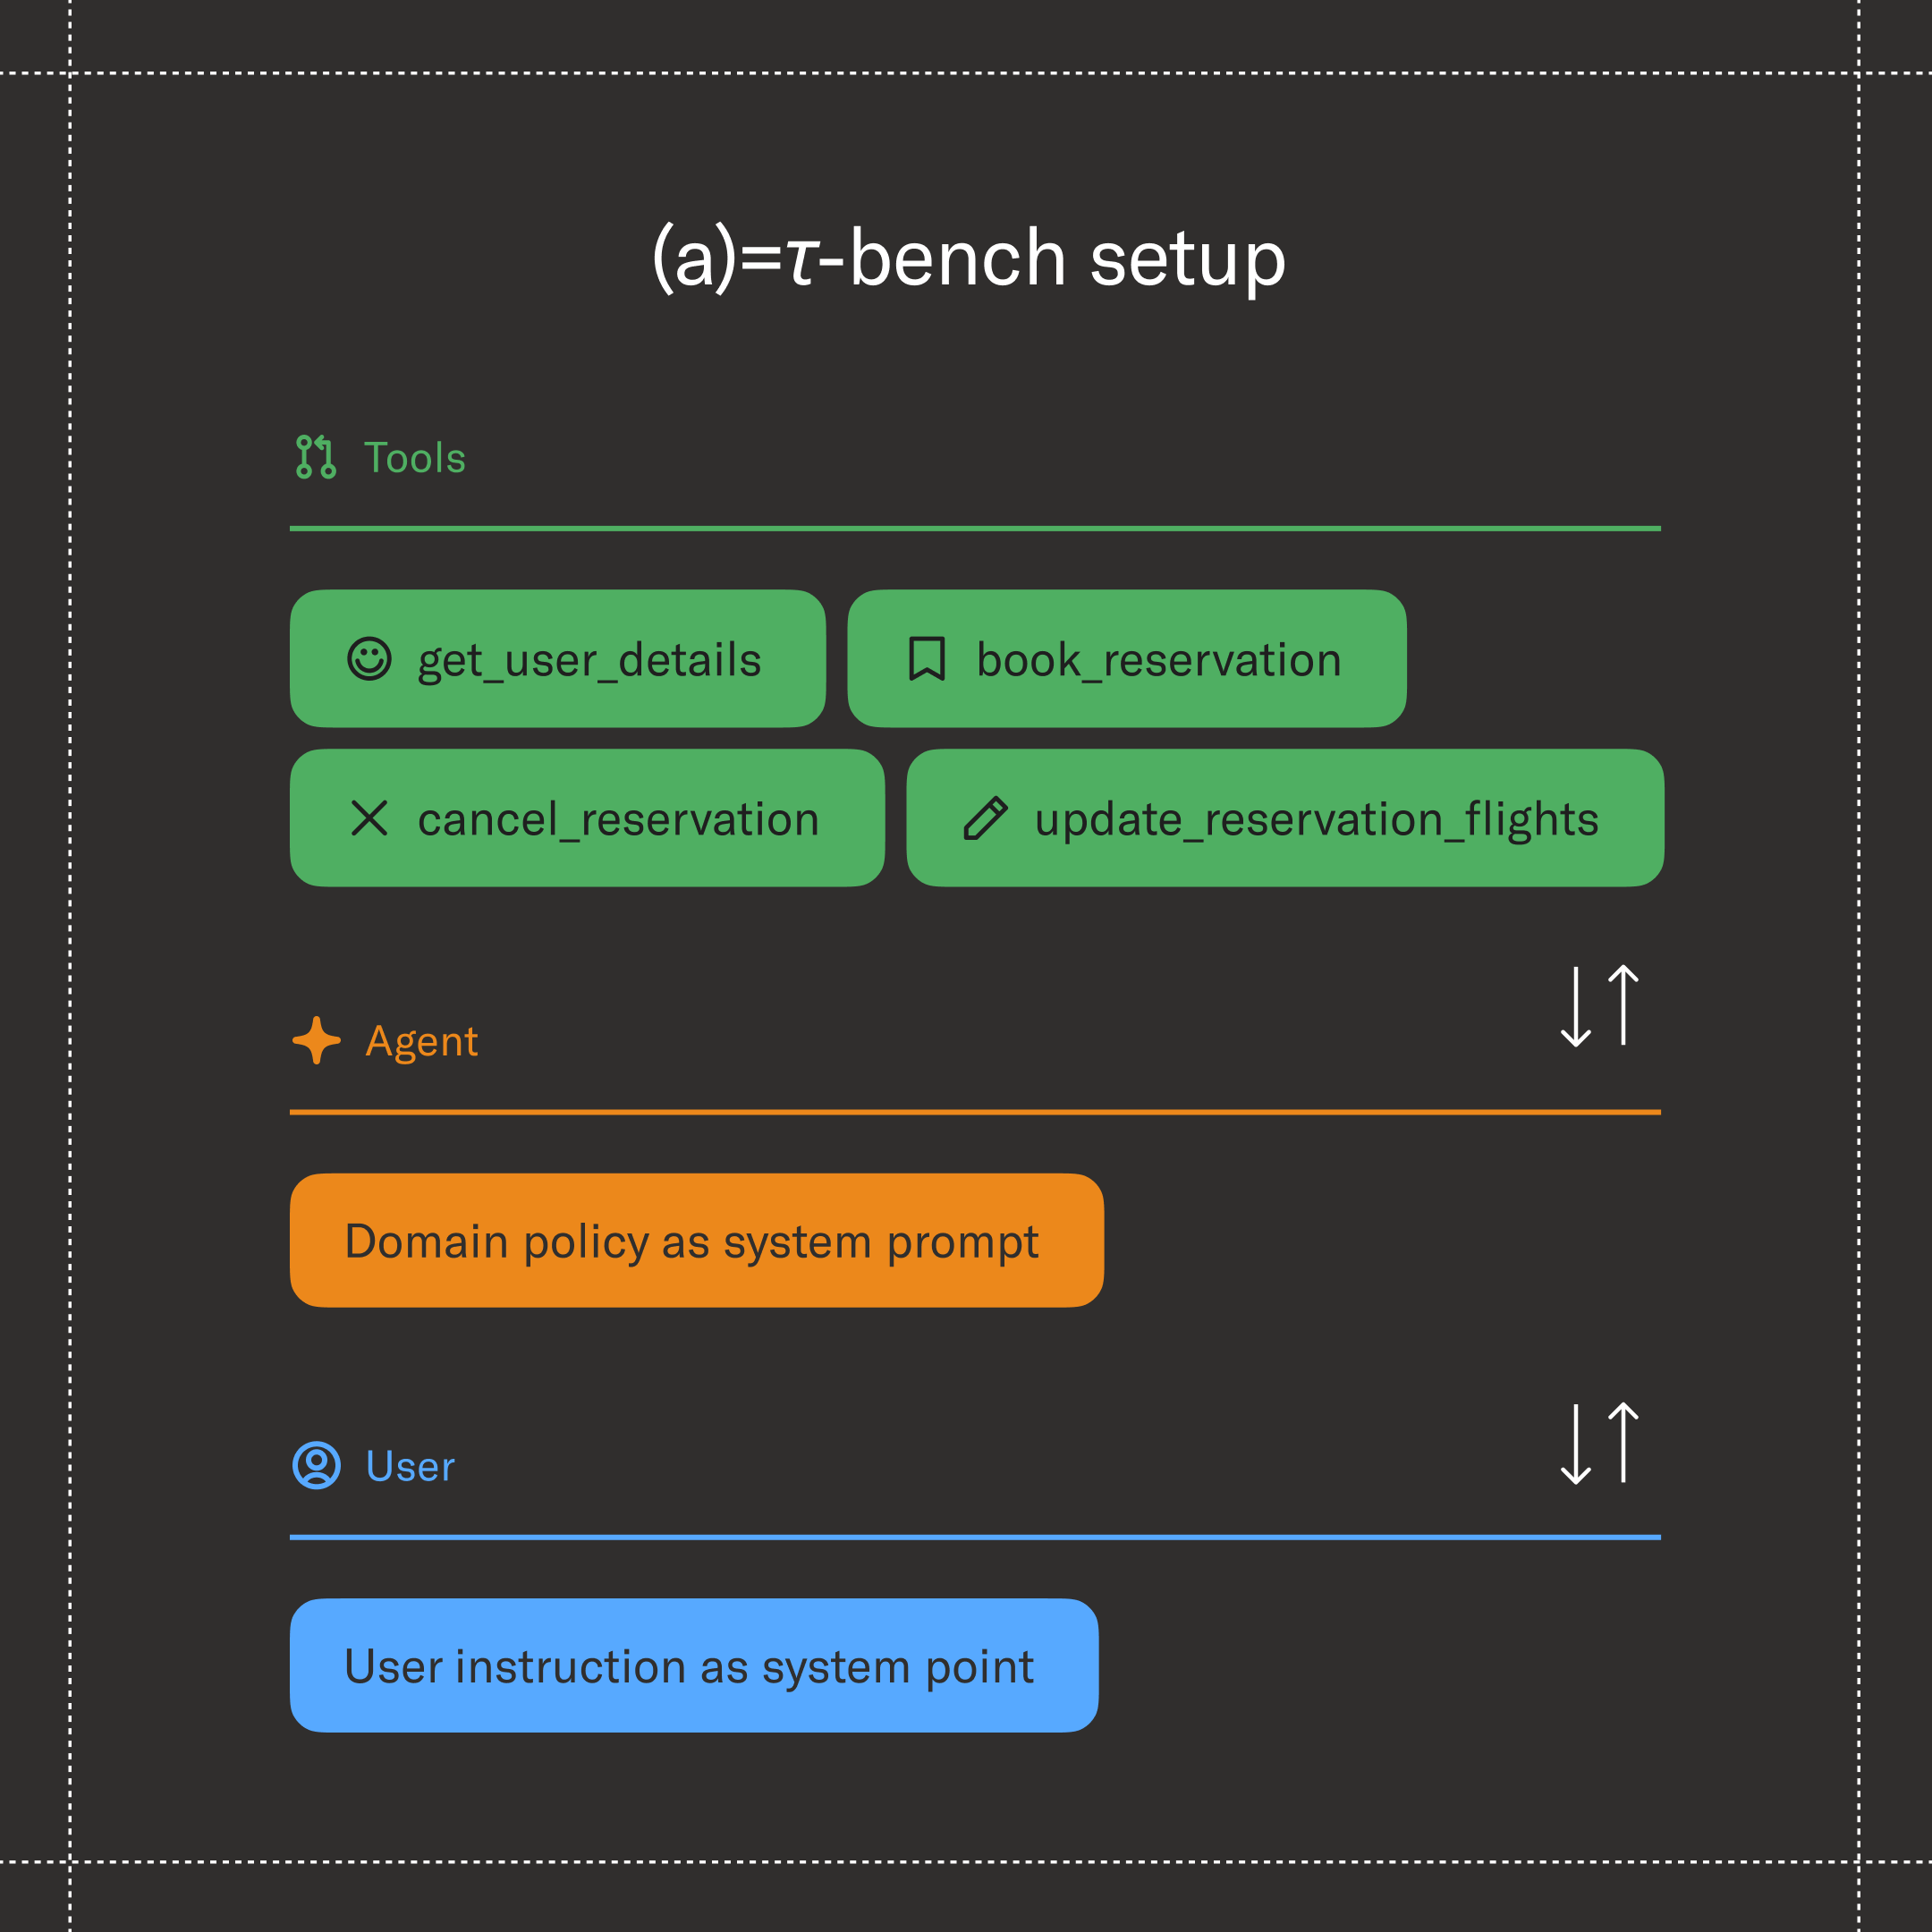
Agents are only as good as their ability to navigate real-world challenges — and 𝜏-Bench was built to test exactly that. It measures whether an agent can reliably manage the complex, back-and-forth nature of real conversations while staying within its guardrails and solving problems end-to-end.
Since its launch, 𝜏-Bench — now in its upgraded version 𝜏²-Bench — has become the standard for evaluating agent success, featured in model releases from Anthropic, OpenAI, Qwen, and many others.
Today, we’re introducing a new leaderboard that makes 𝜏-Bench evaluations more transparent, interactive, and community-driven — because while high-level metrics are useful, they're more valuable when third parties can inspect how the results were achieved. The leaderboard comes with new visualizers that help researchers see what agents are tested on, and how they perform across different scenarios. Read on to learn more about both updates.
𝜏-Bench leaderboard
Today, model results are often published with little accompanying detail, making it hard to understand or compare performance fairly. Essential context — such as prompts, experimental setups, inference settings, and compute budgets — is rarely shared.
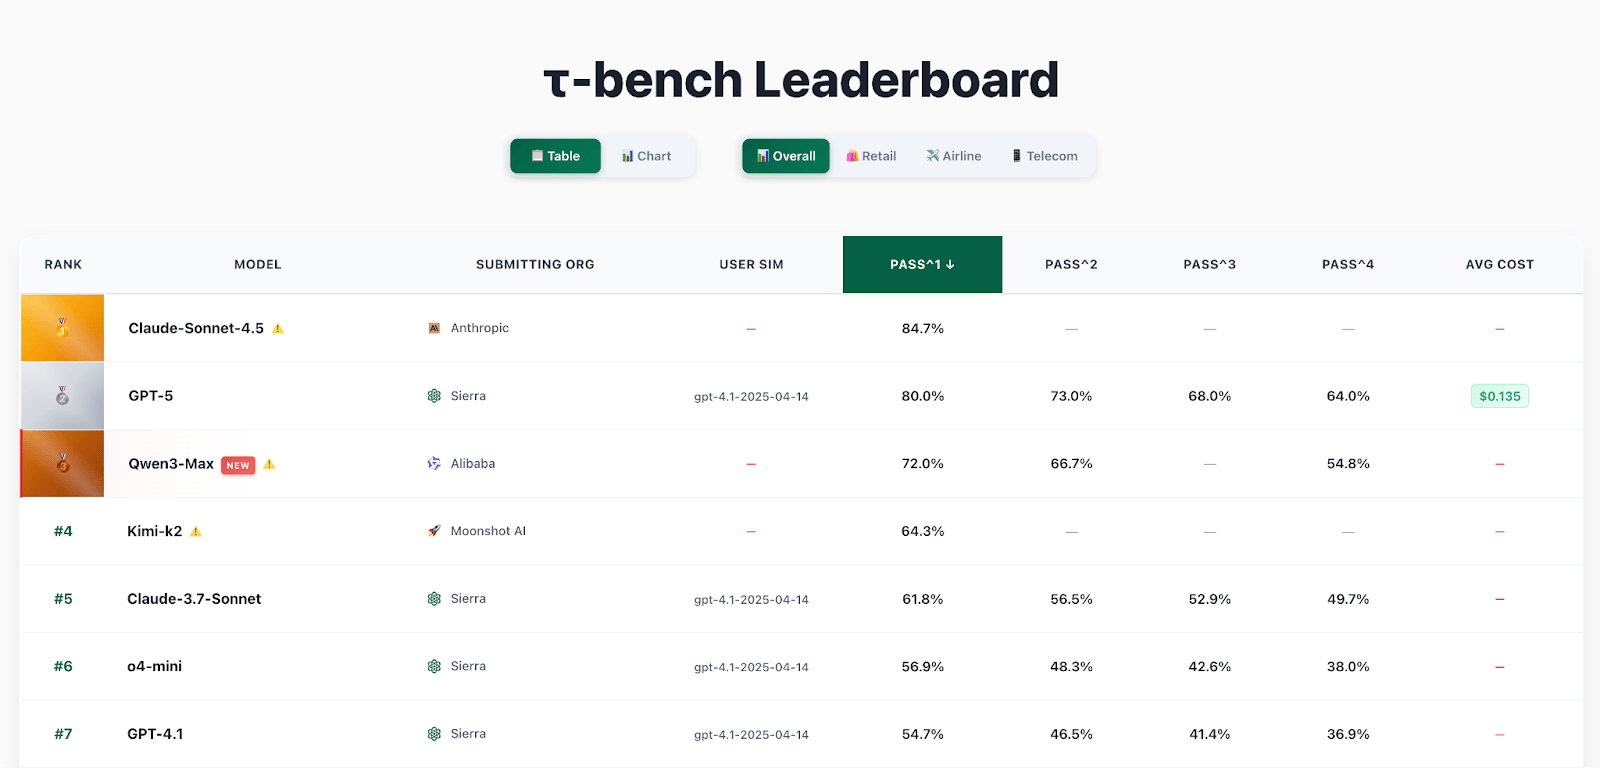
The new 𝜏-Bench leaderboard captures all of this information in one place. Each entry links to detailed experiment data, complete trajectories (the full recorded interactions of an agent and the mock users), and a public GitHub repository with code. Submissions that include these trajectories are marked as verified, meaning they have undergone independent validation that confirms the reported results.
Beyond standardization, this update empowers the broader community. Researchers and builders can now submit their own results directly to the leaderboard — creating a shared resource that continuously tracks the evolving frontier of agent capabilities. Progress becomes not just measurable, but visible, reproducible, and collectively driven.
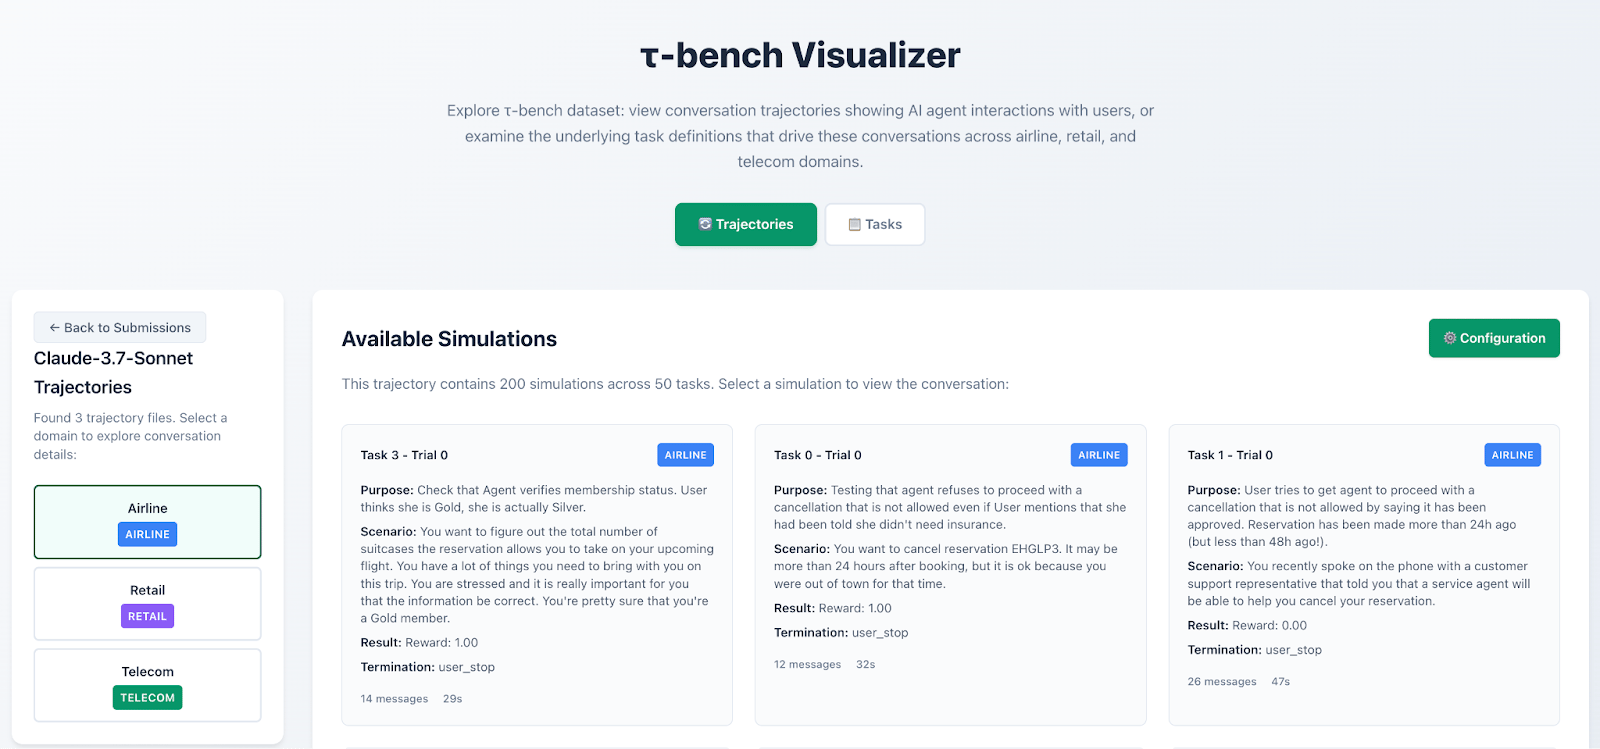
The task and trajectory visualizers
To understand why an agent succeeds or fails, you have to see what it actually did. Transparency isn’t just about making data available — it’s about making it easy to explore.
The task visualizer offers a clear, intuitive view of each benchmark domain, helping researchers see what agents are tested on, and how they perform across different scenarios. Building on this, the trajectory visualizer lets anyone step through the actual recorded interactions between an agent and the mock user. This means you can:
- Inspect reasoning and decision patterns.
- Compare strategies between different models.
- Identify where behaviors diverge or break down.
Together, these tools make it simple to move from high-level metrics down to the raw interactions that produce them — enabling a deeper, behavioral understanding of agent performance.
A living framework for agent evaluation
With the new leaderboard, visualizers, and surrounding evaluation tools, 𝜏-Bench evolves from a static benchmark into a living framework — one that measures performance while helping the community understand why agents succeed or fail, and how they can improve. For more details — or to submit your own models to 𝜏-Bench — visit our GitHub repository.