Agent Traces: getting to the fix, fast
Debugging software is hard. Debugging agents is harder.
In traditional software development, we’ve spent decades building products to understand performance, catch issues early, and optimize systems. Observability products help us minimize MTTD (mean time to detect) and MTTR (mean time to resolve), and over time they’ve become indispensable to running software at scale.
But agents are different. They don't just execute code, they make decisions: orchestrating dozens of steps, across multiple calls to LLMs and other external tools. To make great agents, you need visibility into that decision-making.
That’s why we built Agent Traces.
Metrics aren't enough
High-level metrics like resolution rate or CSAT are useful for spotting trends. But they don’t explain how an agent behaved the way it did.
To diagnose issues or optimize performance, you need to go deeper: turn by turn, task by task. Traditional logs only show inputs and outputs. Traces show you the path in between — and for agents, that “why” matters as much as the final result.
What are Agent Traces?
Think of traces as the step-by-step decision path of every agent message in every conversation — whether it’s a live customer interaction, a manual test, or a simulation.
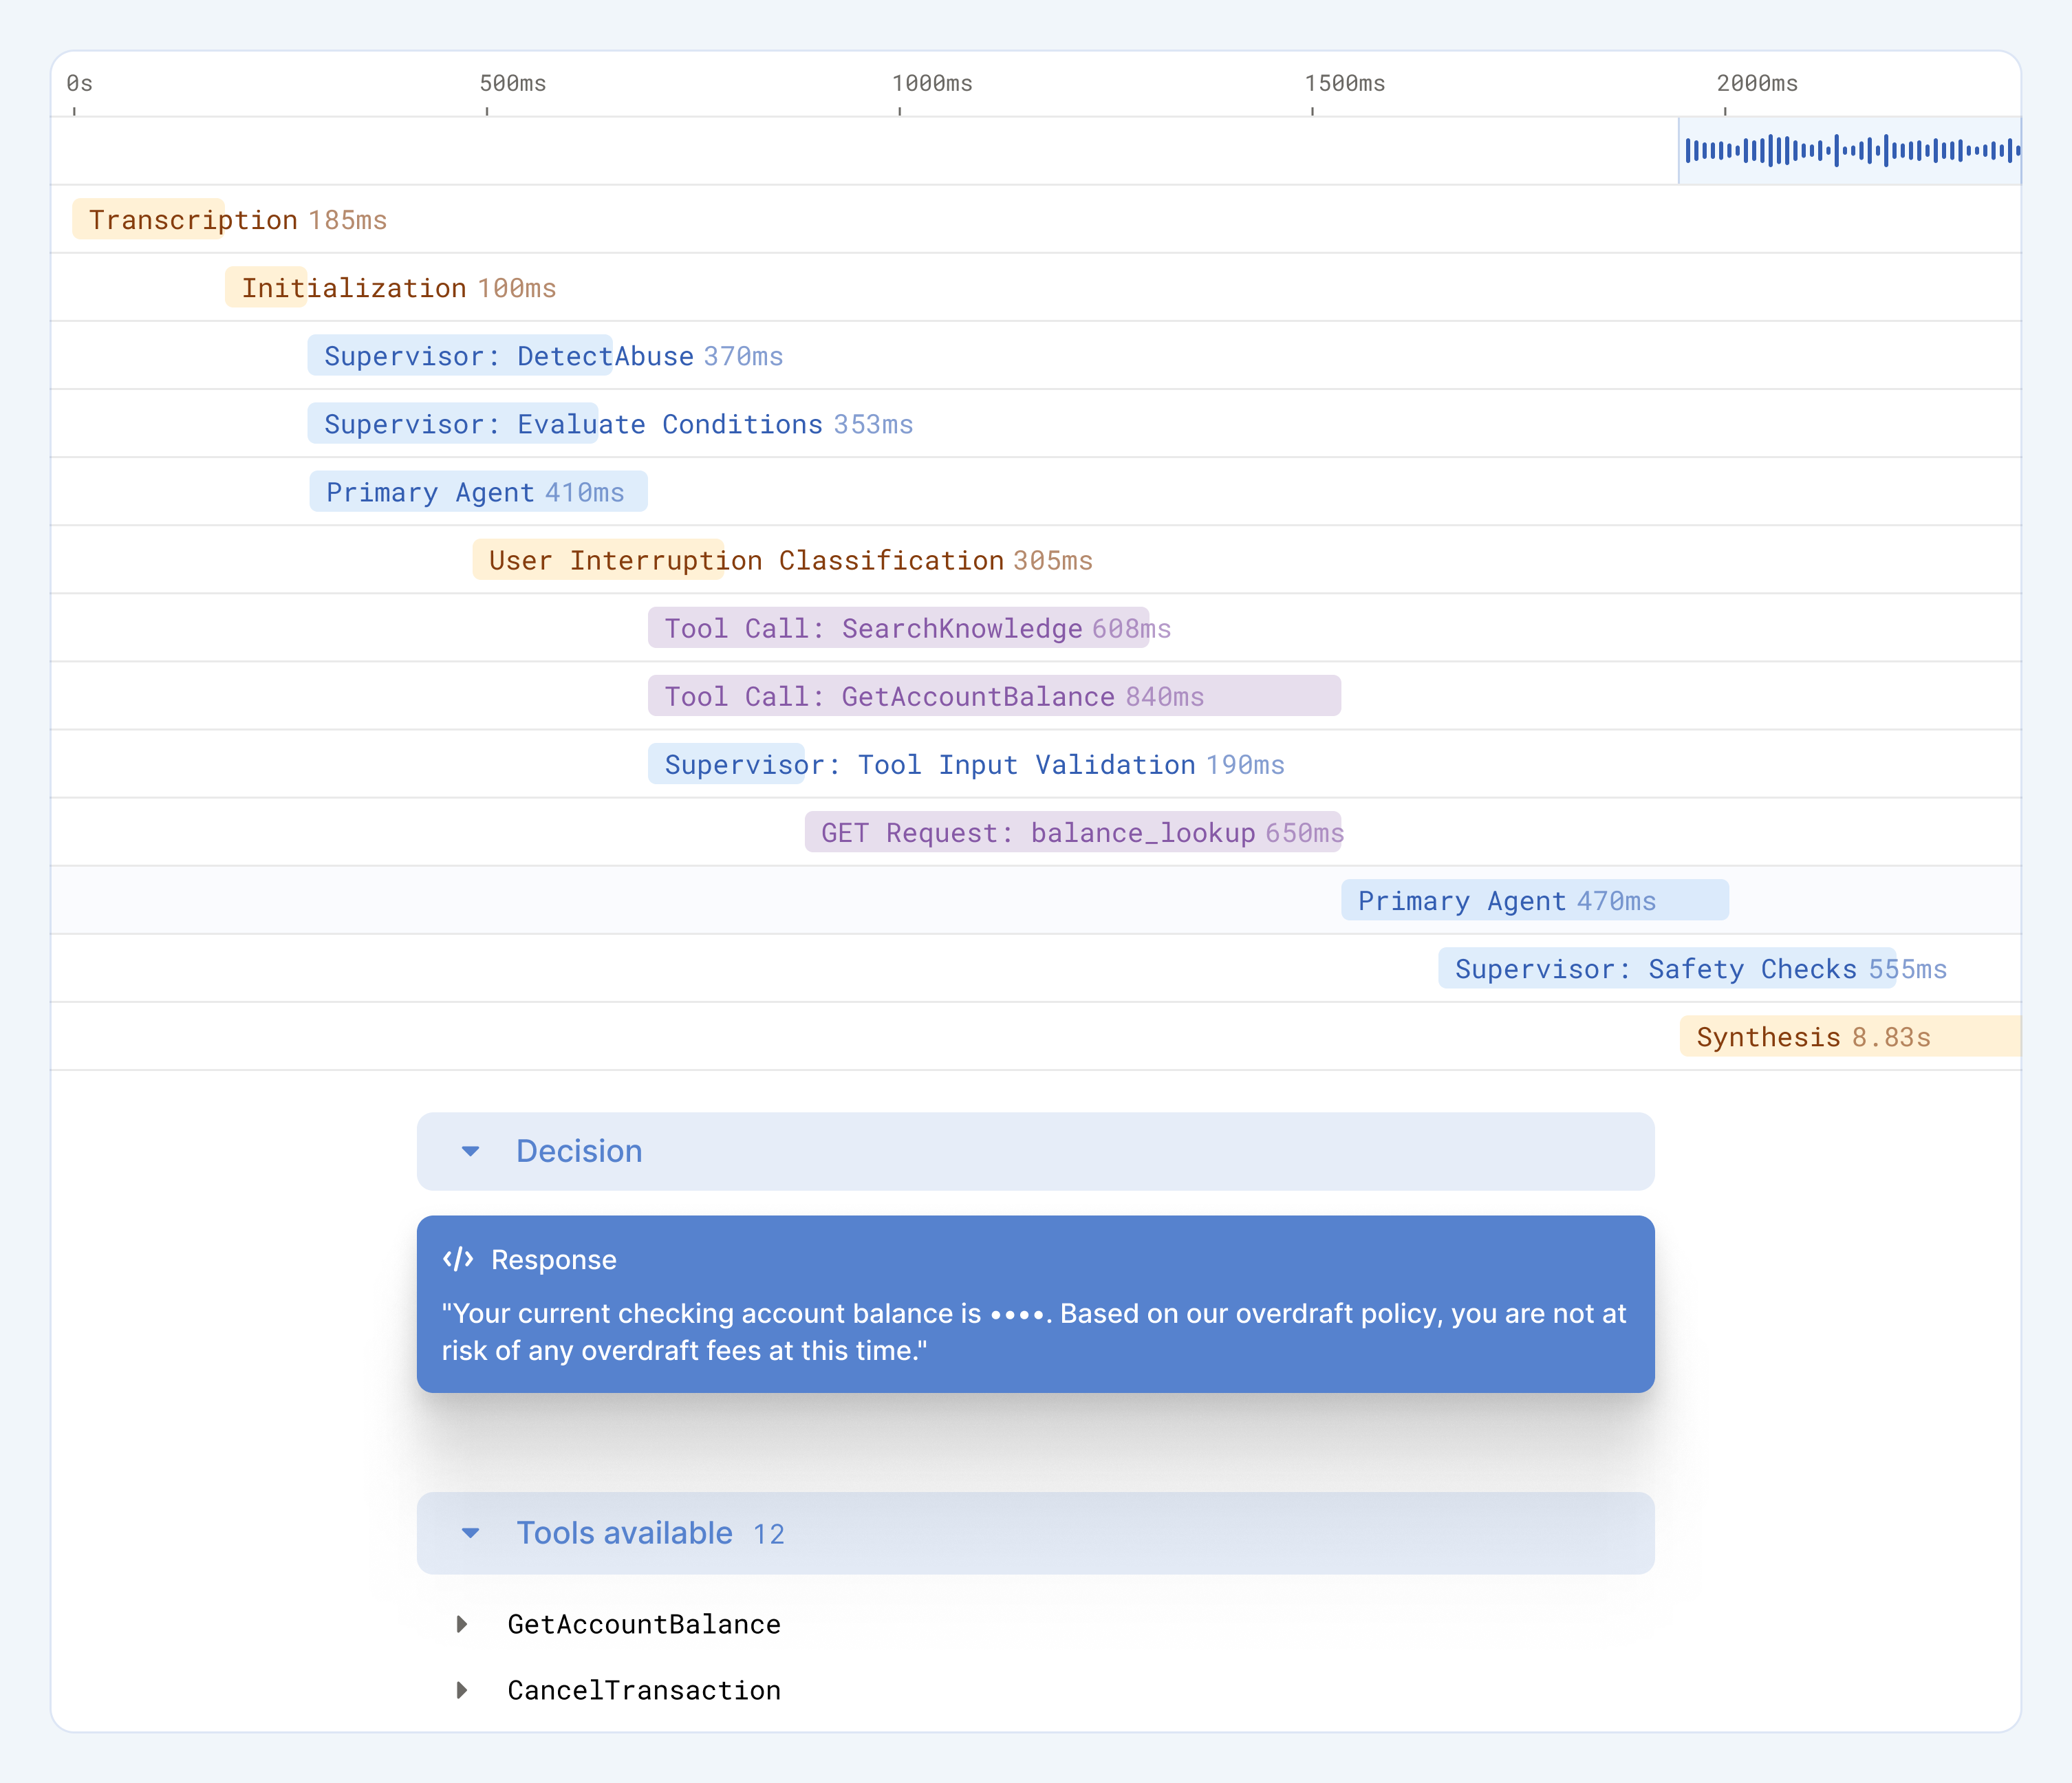
They reveal an agent’s full reasoning path: instructions, tool calls, knowledge lookups, network requests, language guidance, and more. Alongside each step, Agent Traces gives the precise timing, so you can not only see what happened, and why, but how long it took each step of the way.
Always on: in testing, and in production
Every agent message generates a trace. That’s true in production, where you can monitor live conversations — but just as importantly, it’s true during testing. And because Agent Traces are available in simulations and in manual test conversations, you can catch and fix problems before they ever reach a customer.
Latency insights
For agents — especially voice agents — latency is part of the user experience. Agent Traces break down exactly how long each step takes.
Maybe a tool call reliably fires in 1.2 seconds, but an API call lags at 1.5 seconds. That’s a clear optimization opportunity. Traces highlight the bottlenecks so you can ensure your agent is fast and responsive.
Actionable debugging
The real power of Agent Traces is that they answer why.
- Why did the agent choose a particular tool?
- What other options did it have?
- Did conflicting instructions push it down the wrong path?
- Was the orchestration logic flawed?
Agent Traces captures both Sierra’s Agent OS building blocks and your custom components, like API calls, so you can see not only what your agent did, but also how your design choices impacted its behavior.
Designed for builders
We built traces to be practical:
- Scan quickly: See conversations at a glance, and spot where something looks off.
- Drill down if needed: Instead of sifting through raw prompts, Agent Traces surface the decision tree directly, showing what choices led to specific behaviors.
- Adapt your workflow: No-code builders get a simplified view of reasoning, while SDK developers can explore deeper details.
An open book
Juggling 10+ LLM calls and external tools is no small feat. Agent Traces is an open book, making all that complexity manageable. It’s a cornerstone of Sierra’s development suite — helping every team, from customer experiences to engineering, fix faster, optimize smarter, and build with confidence.